Chat on WhatsApp

Revolutionizing Goods Train Operations with Analytics

Info

Category :Data Analytics

Date :10 Dec, 2024

Client :Leading Rail Freight Operator

train-info
train-introduction

Introduction

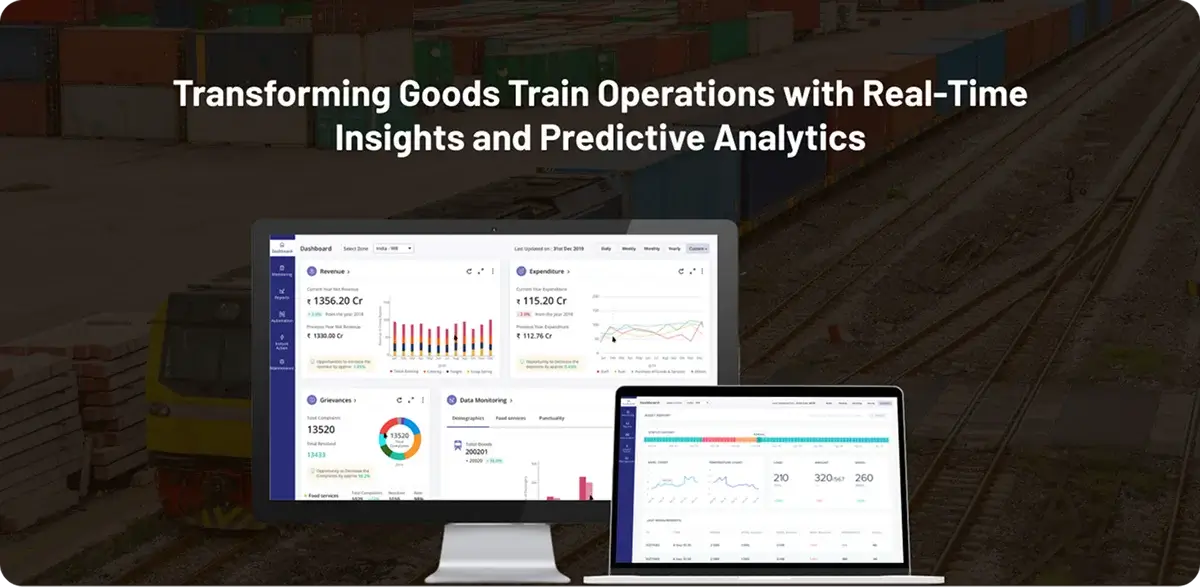
The logistics and transportation industry is rapidly changing as rail freight companies implement innovative, data-driven solutions that increase operational efficiency. A case study on the building of a robust Goods Train Dashboard helps us understand how to improve goods train operations in spite of its unique challenges. This solution will leverage advanced technologies like AWS Glue, Snowflake, Power BI, and Amazon Redshift to seamlessly integrate, process, and visualize real-time data to enable smarter and faster decision-making and redefine operational excellence in rail logistics.

Client Requirements

The client required a centralized dashboard to integrate real-time data to deliver actionable insights and enable predictive analytics for optimizing train operations, reducing downtime, and improving efficiency.

Key Features of the Goods Train Dashboard

01 real-time-train-icon

Real-Time Train Positioning

Track train locations and movement with GPS-enabled current updates. Predictive alerts based on mileage, wearing of components, and climatic conditions to reduce downtime.
real-time-train-img
02 fuel-consumption-icon

Fuel Consumption Summary

Understand fuel usage across routes and engine types to improve and reduce costs.
fuel-consumption-img
03 load-efficiency-icon

Load Efficiency in Visualization

Get detailed metrics concerning cargo weight and volume, as well as in terms of loading and unloading times for better load distribution.
load-efficiency-img
04 multi-departmental-icon

Multi-Departmental Accessibility

Role-based access to the dashboard is tailored for operators, dispatchers, and maintenance teams to cater to specific needs.
multi-departmental-img

Results

Understanding Target Audience

  • Data Integration Across Legacy Systems: It was a challenge to integrate real-time data from multiple disparate legacy systems, requiring advanced ETL processes.
  • DReal-Time Processing: Processing and visualization of real-time data without latency were significant challenges.
  • Scalability: Designing a solution capable of handling data spikes from multiple trains without compromising performance was critical.
  • Predictive Analytics Accuracy: Building reliable machine learning models for predictive maintenance required extensive historical data and fine-tuning.

How we Resolved

  • Research & Planning: It started by deeply assessing the needs of the client and the operational challenges he faces. A complete roadmap was developed incorporating data integration, real-time insights, and
    predictive analytics capabilities.
  • Development & Testing: AWS Glue, Snowflake, and Amazon Redshift were used to develop a scalable data pipeline. Iterative testing on an error level ensured that updates on the dashboard were precise in real time
    and smooth interactions between the data sources and the dashboard. Machine learning models for predictive analytics were perfected using Python.
  • Implementation and Training: The dashboard deployed was real-time and history, so the information came out instantly. Conduct staff training to maximize the platform uptake and efficient use of it.
  • User Feedback and Improvement: After deployment, feedback was collected from users to find extra areas of improvement for need. Enhancements phased-based rollout included role-based view dashboards and further
    improving of predictive analytics models.

How to do App Promotion

  • Research & Planning: It started by deeply assessing the needs of the client and the operational challenges he faces. A complete roadmap was developed incorporating data integration, real-time insights, and
    predictive analytics capabilities.
  • Development & Testing: AWS Glue, Snowflake, and Amazon Redshift were used to develop a scalable data pipeline. Iterative testing on an error level ensured that updates on the dashboard were precise in real time
    and smooth interactions between the data sources and the dashboard. Machine learning models for predictive analytics were perfected using Python.
  • Implementation and Training: The dashboard deployed was real-time and history, so the information came out instantly. Conduct staff training to maximize the platform uptake and efficient use of it.
  • User Feedback and Improvement: After deployment, feedback was collected from users to find extra areas of improvement for need. Enhancements phased-based rollout included role-based view dashboards and further
    improving of predictive analytics models.

Result

cs-result-img

Technology Stack

Technology we used

AWS-Glue-icon

Data Integration AWS Glue

snowflake-icon

Data Warehousing Snowflake

powerBI-icon

Data Visualization Power BI

amazon-redshift

Analytics & Processing Amazon Redshift
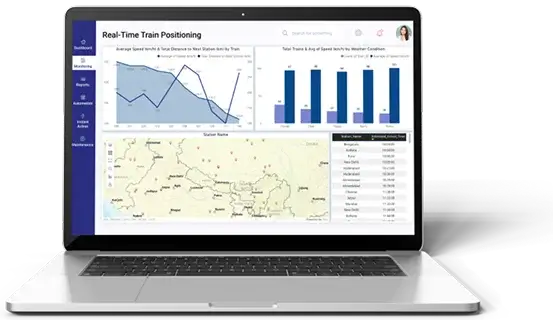
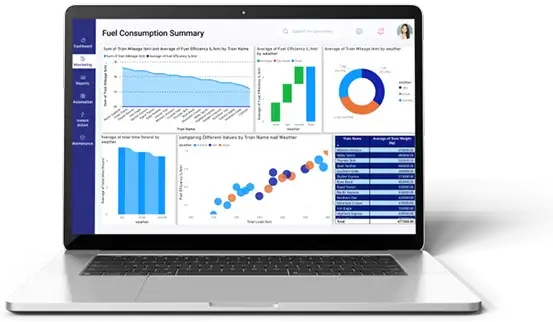
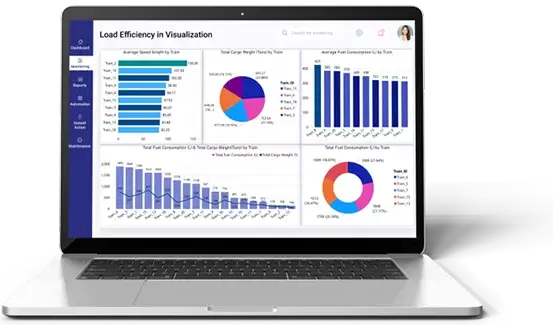