Project Duration:6 months (Discovery to Production Deployment)
Industry: Distribution & Supply Chain Management
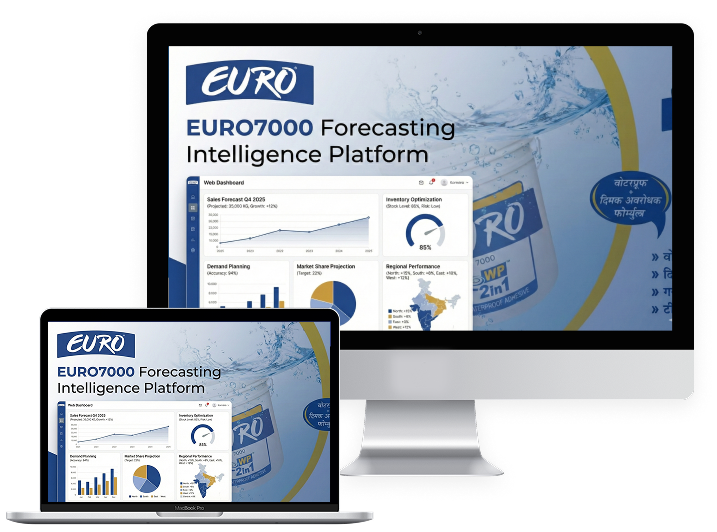
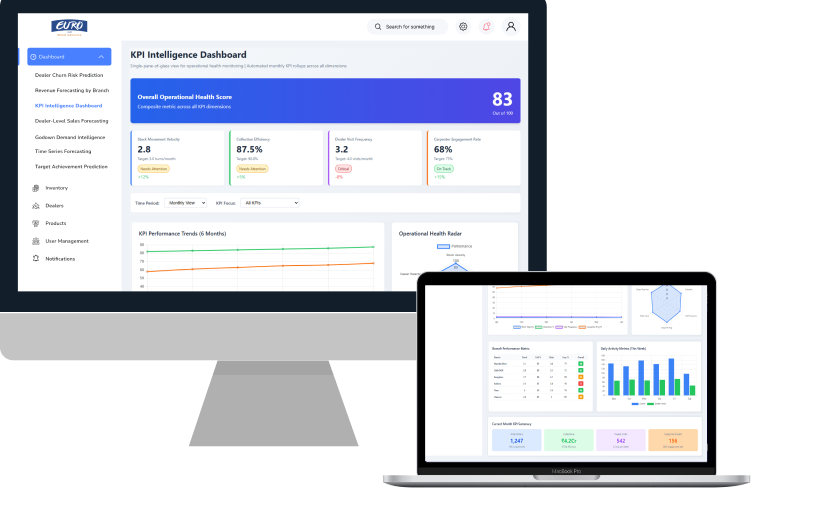
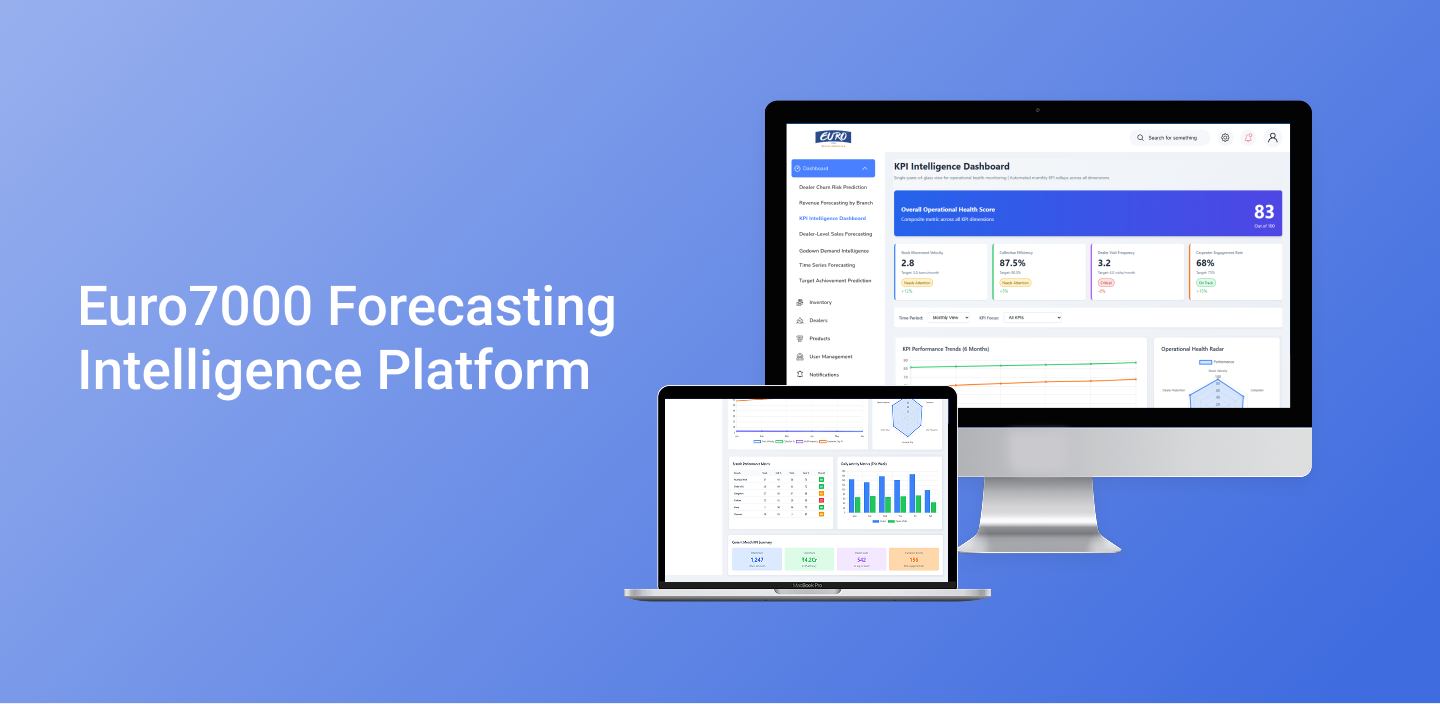
Our team successfully delivered a comprehensive Forecasting Intelligence Platform for a leading distribution enterprise, transforming their operational data ecosystem from fragmented, siloed systems into a unified, real-time analytics powerhouse. This end-to-end solution combines advanced statistical modeling, machine learning forecasting, and intuitive visualization to drive strategic decision-making across sales, inventory, and dealer relationship management.
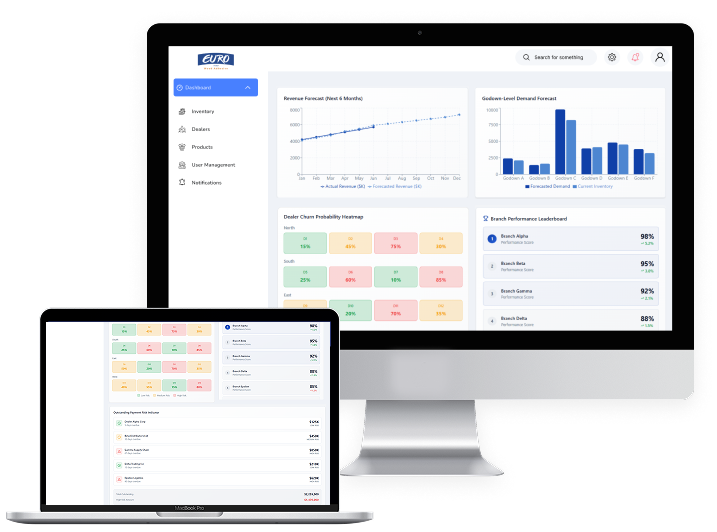
The client required an end-to-end forecasting and analytics platform that would eliminate manual reporting burdens, provide real-time visibility into operational health across 15+ key performance indicators, and transform their approach from reactive problem-solving to proactive, data-driven decision-making. The solution needed to preserve their existing Tally ERP investments while unlocking advanced analytical capabilities, be accessible to non-technical stakeholders across sales, operations, and executive teams, and scale to support future growth and increasingly sophisticated analytical use cases.


Our client faced critical operational blind spots that were hindering growth and efficiency:
Quantifiable Outcomes (Post-Implementation)
| Metric | Before | After | Improvement |
|---|---|---|---|
| Time to Insights | 5–7 days | < 4 hours | 97% faster |
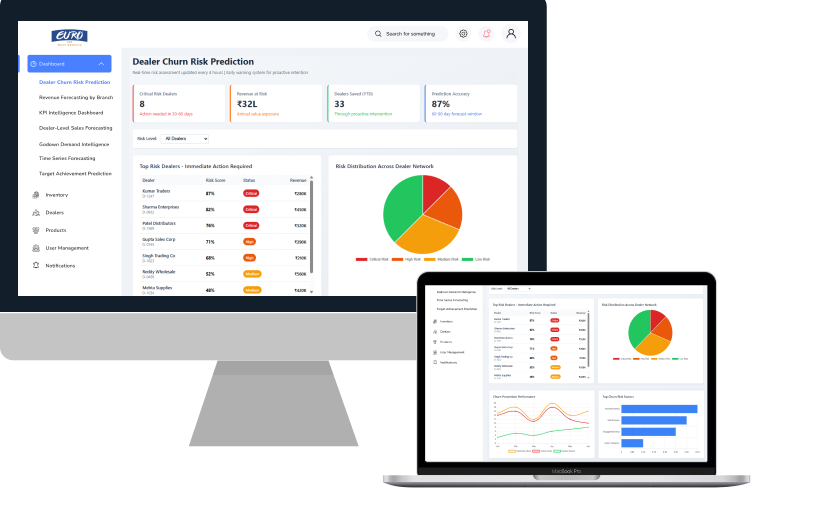
| Dealer Churn Rate | 18% annually | 12% annually | 33% reduction |
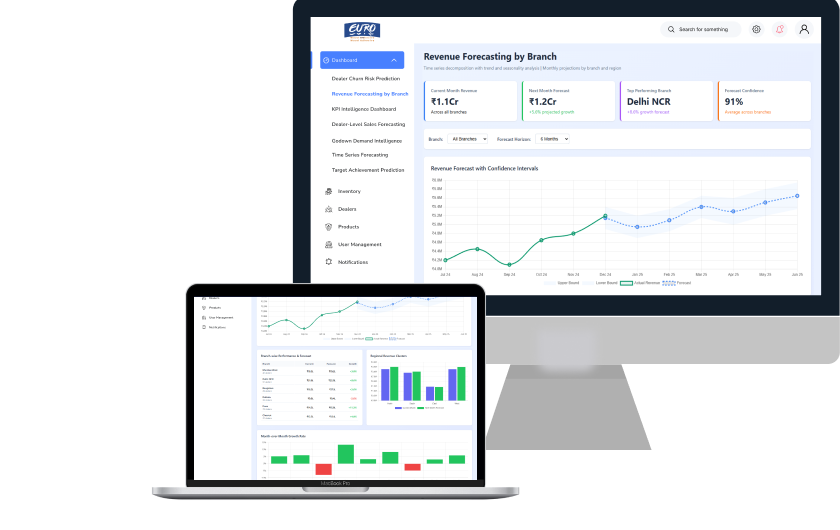
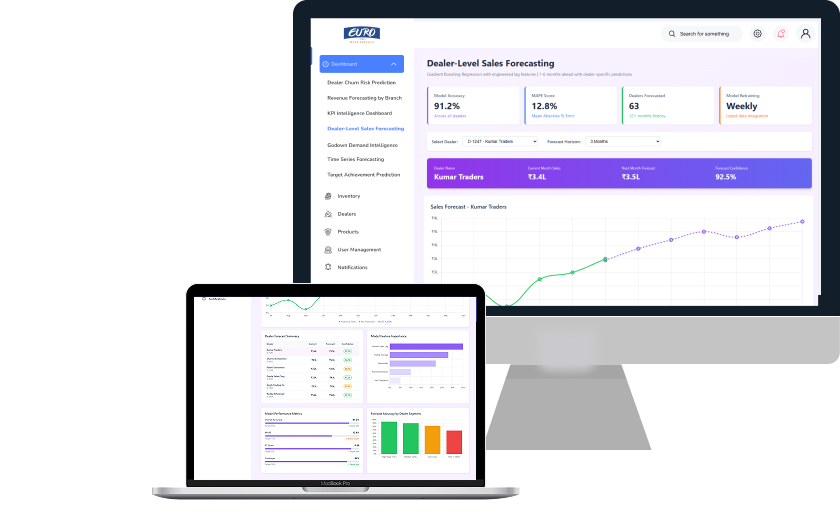
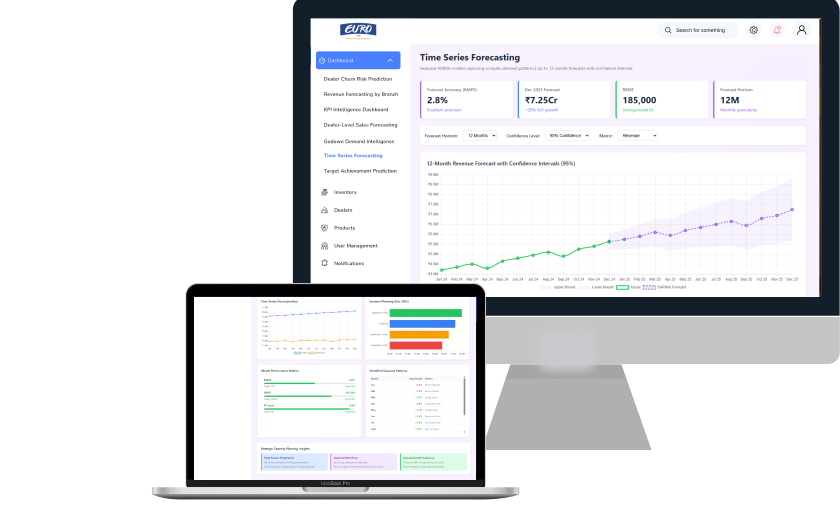
| Forecast Accuracy | N/A (no forecasting) | 85% (MAPE 15%) | New capability |
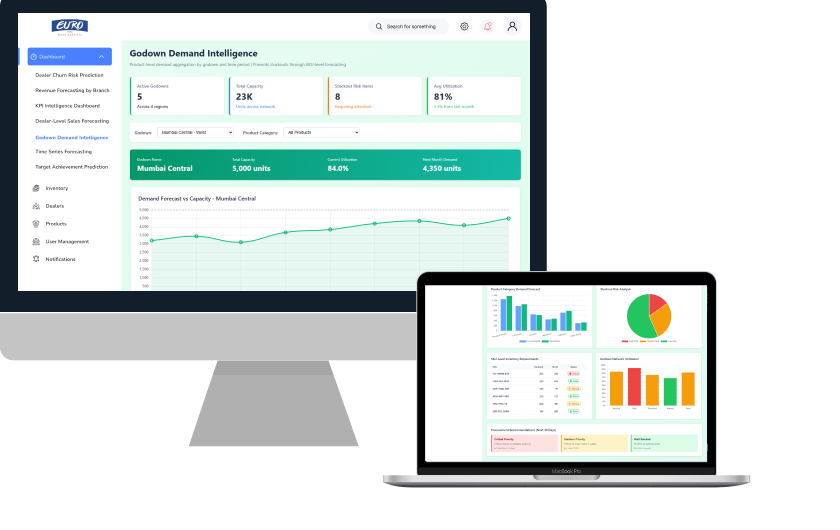
| Inventory Stockouts | 23 instances/month | 8 instances/month | 65% reduction |
| Manual Reporting Hours | 160 hrs/month | 10 hrs/month | 94% efficiency gain |
Strategic Benefits
Technologies we used

Apache Airflow

snowflake
XGBoost

Streamlit
This project exemplifies our commitment to building production-grade, business-focused solutions that deliver measurable ROI. The platform’s architecture ensures scalability for future growth, while its intuitive design guarantees sustained adoption across all organizational levels. From automated data pipelines to real-time predictive dashboards, every component was engineered to bridge the gap between raw data and strategic decision-making.
