Chat on WhatsApp

Data-Driven Doctor Performance Analytics for Synergy Medical Group

Info

Domain: Healthcare Analytics | SEO Performance | Cloud Data Engineering 


Introduction

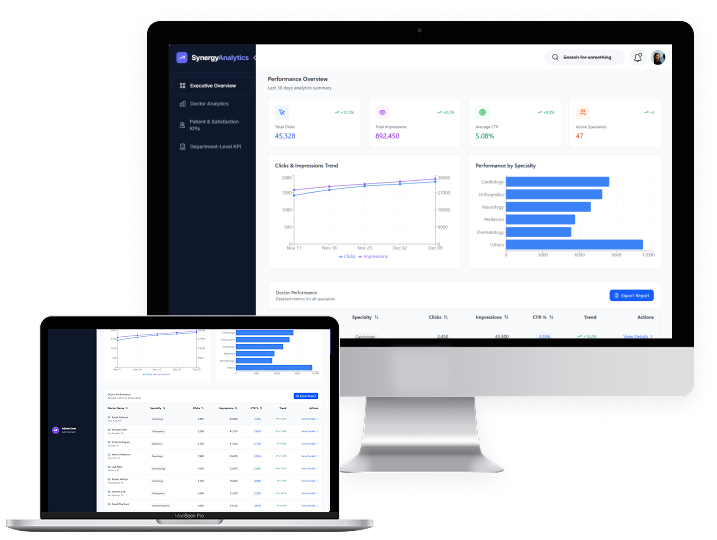
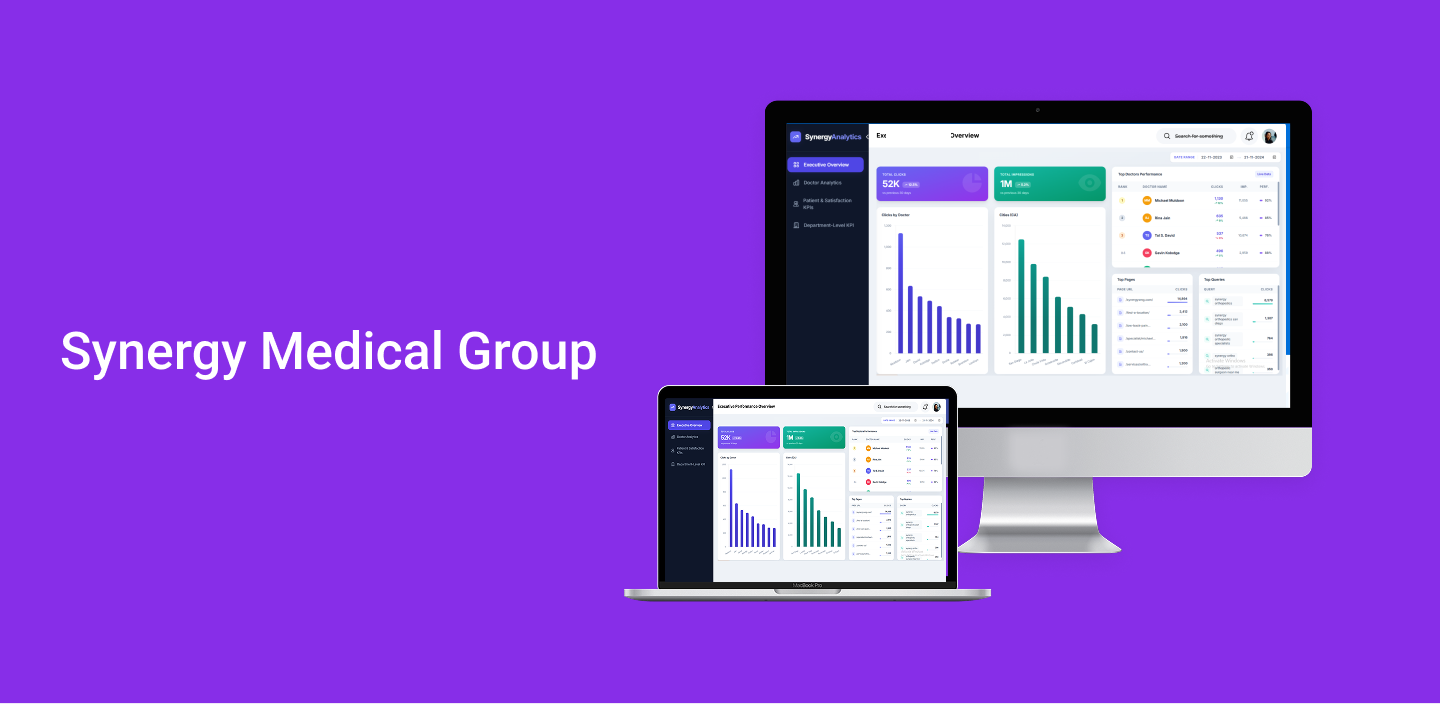
Healthcare professionals today rely heavily on digital presence to reach and engage patients. The Synergy Medical Group sought to evaluate how effectively its specialists were performing online, particularly in local search visibility and engagement metrics. Our team designed a comprehensive data pipeline integrating multiple technologies to generate personalized analytical reports for each doctor, uncovering trends in keyword performance, CTR (click-through rate), and impressions. 

Client Requirements

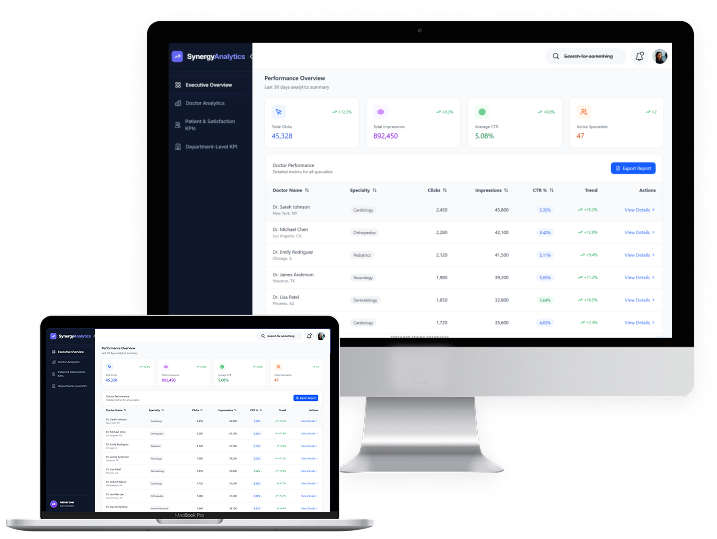
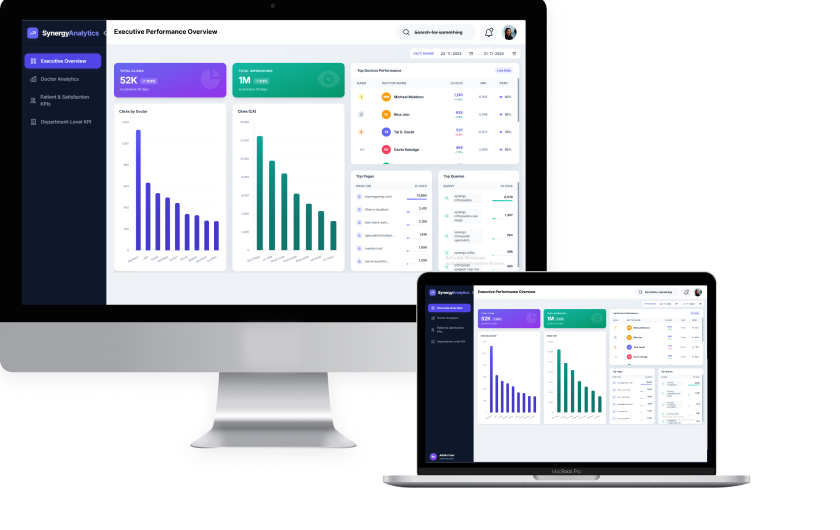
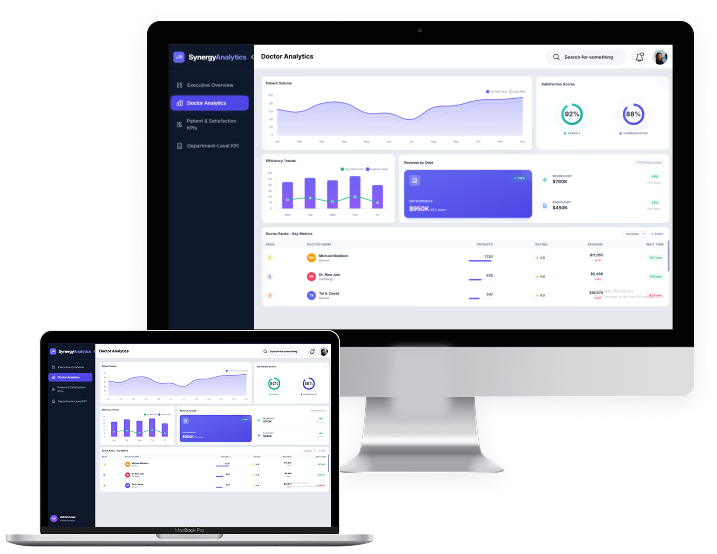
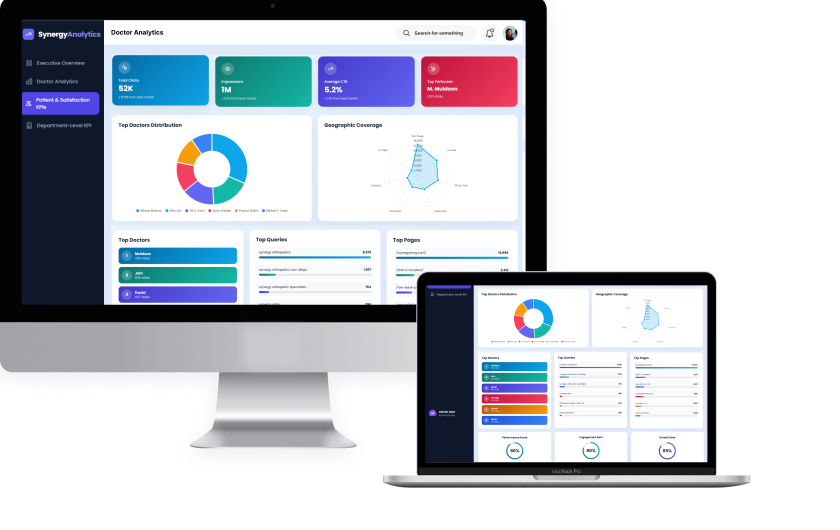
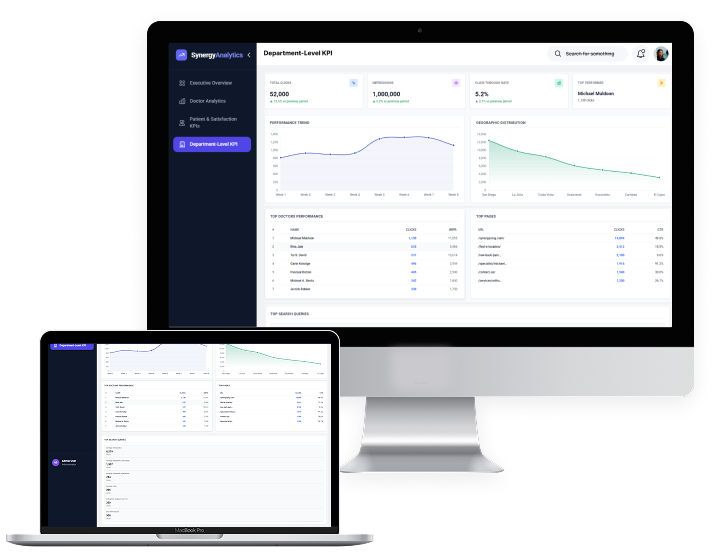
Consolidate engagement metrics for all doctors on Synergy’s “Find a Specialist” portal and track keyword performance-including CTR, clicks, and impressions-to assess digital visibility. Generate individualized reports providing key insights and actionable recommendations for doctors, while enabling leadership to monitor doctor-wise performance through interactive visual dashboards. The system ensures scalable data storage and efficient querying to support continuous analytics and decision-making.

KPIs of Synergy Medical Group

01

Engagement & SEO KPIs

These KPIs measure how effectively doctors and specialty pages attract and engage online users across search engines. They capture visibility signals like impressions, as well as user actions such as clicks and keyword performance. By tracking growth trends and top-performing queries, these metrics reveal how well each doctor ranks in local search and where optimization opportunities exist. Overall, they form the foundation for understanding digital reach and audience interest.
02

Doctor Performance KPIs

This set of KPIs evaluates each doctor’s online and operational performance using a mix of visibility, engagement, and productivity metrics. From clicks and impressions to patient volume, revenue, and ratings, these indicators showcase how a doctor performs across digital channels and real-world service delivery. The combined performance score helps leadership identify high performers, emerging specialists, and profiles needing optimization. These insights directly guide marketing strategy and resource allocation.
03

Patient & Satisfaction KPIs

These KPIs focus on the patient experience - measuring how many patients visit, how well they rate their interactions, and how effectively doctors communicate. They highlight patient sentiment, service quality, and overall satisfaction trends across the organization. By monitoring feedback and communication scores, leadership can identify operational bottlenecks and areas where patient experience can be improved. These insights drive trust-building and better care outcomes.
04

Department-Level KPIs

Department-level KPIs provide a financial and operational overview of each specialty within the organization. They track revenue, growth rate, and departmental contribution to overall earnings, enabling leadership to identify high-performing units and underutilized areas. These metrics help evaluate strategic focus, optimize resource distribution, and uncover opportunities for expansion. They ultimately guide organizational planning and long-term growth decisions.

Challenges and Approach

  • ETL Optimization: Designing near real-time ETL workflows to process keyword metrics efficiently while minimizing processing overhead. 
  • Keyword Standardization: Managing variations in doctor name keywords to maintain clean, unified analytics. 
  • Sparse Data Handling: Addressing limited impressions and clicks for low-CTR profiles like Dr. Steven Nguyen to avoid skewed performance metrics. 
  • Data Compliance: Ensuring all data operations adhered to HIPAA guidelines, even when dealing with non-clinical metadata. 
  • Snowflake–Power BI Integration: Building a seamless live connection between Snowflake and Power BI for dynamic, low-latency dashboard updates. 

  • Increased Efficiency: Automated reporting reduced manual effort by 80%. 
  • Improved SEO Performance: CTR improved by 15–20% for optimized doctor profiles. 
  • Enhanced Data Visibility: Leadership gained a single source of truth for digital engagement analytics. 
  • Faster Decisions: Real-time Power BI dashboards enabled quick, data-driven marketing decisions. 
  • Scalability: The pipeline supports onboarding of new doctors seamlessly. 
  • ROI Uplift: Local keyword optimization led to 22% growth in organic visibility. 

Key Outcome

Technology Stack

Technologies we used

AWS Glue

Apache Spark

Snowflake

Power BI

Conclusion

This project exemplifies how healthcare organizations can harness data analytics and cloud platforms to measure, optimize, and enhance digital engagement at an individual doctor level. The integration of Snowflake’s data scalability, AWS’s automation capabilities, and Power BI’s visual storytelling transformed static web metrics into insightful, actionable intelligence – driving smarter marketing and improved patient outreach.